Applied Fieldwork
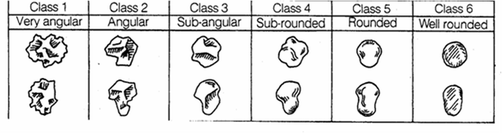
Qualitative Data: Is normally descriptive data an is harder to analyse than quantitative data. It is useful to find out people's opinions and what they think/feel. Eg: A sketch of a beach or the shape of a pebble. It can be taken using no equipment as it is just opinion.

Quantitative Data: Is information about quantities and it can be measured and written down in numbers. Eg: Width of 10 stones. It can be taken using things like Calipers to measure the length of a pebble.
Primary Data: Is information that you collect specifically for your research project. An advantage of primary data is that it is specifically suited to your research. Eg: Data you collect from an OS map. It doesn't necessarily need any equipment to collect it.
Secondary Data: Is data that was collected by someone other than the yourself. Eg: Data someones else collects from a climate graph. Doesn't need to be collected using any equipment.
Random Data: Is data that is collected randomly and isn't collected at regular intervals. Eg: Randomly measuring the length of some pebbles along a beach.
Stratified Data: Is data that is taken not at regular intervals but between certain points. Eg: Taking measurements of the amount of stones using a Quadrat to measure the amount of stones on the beach twice between each groyne.
Systematic Data: Is data that is taken at regular intervals. Eg: Taking a measurement of the gradient of the beach every 3 meters from the sea using Gun Clinometers.
Transect: A transect is a line following along which a survey is made. The transect is a geographic tool for studying changes in human and physical characteristics.
|
Highcliffe Field trip
On the field trip we took readings using Gun Clinometers and meter rulers to measure the gradients of the beach in degrees, we did this by looking through the gun clinometer in line with the top of the rule and lining it up with the top of the next meter ruler three meters away along the transect. We used a quadrat to find out how many stones were at 3 meter intervals going up the beach along the transect. A jug and water to find out the volume of 10 stones in centimeters cubed by putting the stones in jug with 100cm^3 in and subtracted the new value from the original one. Finally measured the length of 10 stones in centimeters using calipers and calculated an average using a calculator. |
|
Null Hypothesis: The direction of longshore drift at Highcliffe does not move in a West to East direction.
We can disprove the null hypothesis because to picture (see below) is taken in a south-westerly direction and it shows that the sand and shingle is built up on the East side of the groynes which shows that longshore drift is happening in a West to East direction.
From our results we can see that there is not a smooth increase in the height as it fluctuates up and down. The width decreases then increases then finally decreases again.
This disproves the hypothesis as there should be a steady increase in the height and the width of the beach 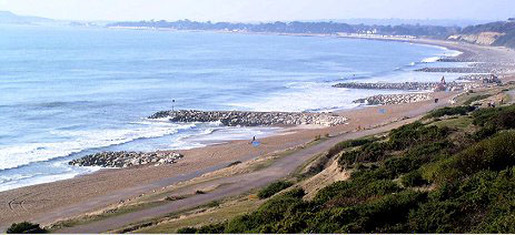
|
|
